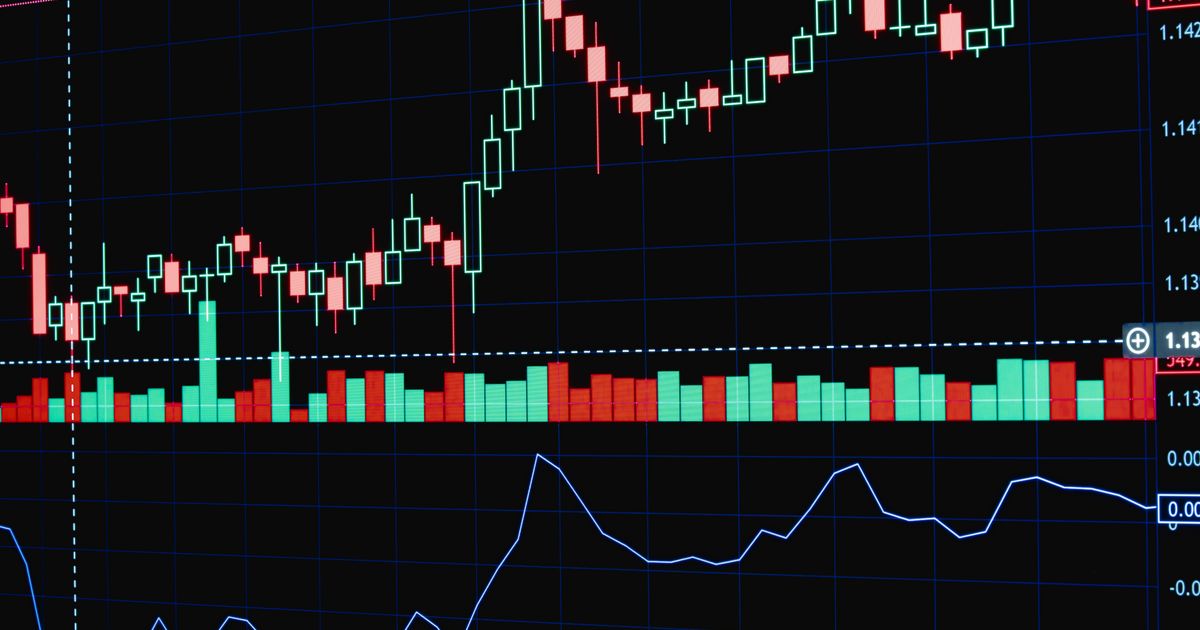
Photo by Rafael Minguet Delgado on Pexels
Bullish Divergence: Why the Signal Confirms Too Late
Quick Answer
Bullish divergence happens when price makes a lower low while an indicator like RSI makes a higher low, signalling that selling momentum is fading. The catch is structural, not personal: because the pattern needs two completed swing points to exist at all, it can only be identified after part of the move it is meant to warn about has already happened. By the time it confirms, you are often buying the reversal at a worse price than the one it was pointing at.
My wife and I have had our own bullish divergence going for twenty years. I make lower lows on optimism, she makes higher lows on patience, and neither of us has ever agreed on what counts as the confirmation candle. If you have marked a textbook bullish divergence on your chart, waited patiently the way every course tells you to, and watched price keep falling anyway, you already know this feeling has nothing to do with patience and everything to do with arithmetic nobody explained.
This post covers why divergence confirms exactly when it is least useful, what actually moves before the oscillator notices, and when the pattern is worth your attention at all. If you came here hoping for a cleaner RSI setting that fixes this, I would rather tell you now that the setting was never the issue.
You saw it three times. It kept failing.
Here is the version most traders have lived through more than once. Price is grinding lower. RSI prints a low, price falls further, RSI prints a higher low. Bullish divergence, clean as the textbook picture. You wait for confirmation like you were taught — a break of the small swing high, maybe a bullish close. It triggers. You pull the trigger too. Price stalls, wobbles, then takes out your stop and makes a new low. Divergence again. Rinse, repeat.
By the third time this happens on the same pair, in the same week, it stops feeling like bad luck and starts feeling personal — like you are missing some subtlety everyone else has figured out. Sure, heard that before: my analysis was right and I still lost. Except this time the "analysis" was a pattern specifically designed to fade a trend, applied inside a trend that had no intention of fading yet.
Bullish divergence is a description, not a signal
Momentum is one of those words that sounds precise and is mostly a vibe. In physics it has an actual definition. In trading, "momentum is fading" usually means an oscillator ticked up while price ticked down — true, and not remotely the same as "the trend is ending." Newton never had to explain this to a chart forum at 11pm, which is one advantage he had over the rest of us.
(Yes, I know how that sounds — like I am about to tell you divergence is useless. It is not. It is a description of weakening momentum on this specific leg, nothing more, and treating a description as a trade signal is the entire mechanism behind why it keeps failing.)
My apprentice once found fourteen bullish divergences on a five-minute chart in a single afternoon, seven of them before lunch. He was very proud. None of them mattered, because a five-minute chart in a strong trend produces fading momentum on almost every pullback — that is what pullbacks are. Overbought and oversold readings come and go like items on a shopping list nobody actually needed; the basket still gets heavier.

Photo by AlphaTradeZone on Pexels
Why the confirmation always arrives late
RSI, the indicator behind most divergence calls, is calculated from a rolling 14-period lookback of recent closing prices. It is already a lagging read on price by construction — nothing sinister, just arithmetic on numbers that already happened.
Divergence adds a second layer of lag on top of that. A divergence pattern only exists once two completed swing points can be compared — the earlier low and the more recent one. You cannot identify it on the first low, only in hindsight once the second low has fully printed. That means the earliest possible moment divergence becomes visible is also, structurally, after part of the move has already happened. Waiting for a confirmation candle on top of that is a bit like waiting for a formal proposal after you have already been living together for a decade — sensible in principle, though the timing rather gives the game away.
Stack it up and you are looking at three separate layers of lag, not one:
- →Indicator lag — RSI and MACD are both calculated from a rolling window of closes that have already printed.
- →Pattern lag — divergence itself only exists once a second swing point can be compared to the first, so it cannot be seen in real time on the low it eventually describes.
- →Confirmation lag — waiting for a break of structure or a candle close adds a third delay on top of the first two, trading false-entry protection for a worse average price.
None of this is a flaw in RSI or MACD specifically. It is what any indicator built from historical price has to be. The FCA consistently reports that the large majority of retail CFD and forex accounts lose money, and a lagging entry method stacked on top of a lagging indicator is a meaningful part of that arithmetic — not because retail traders are careless, but because nobody explained where the lag actually comes from.
What actually moves before the oscillator does
The market is not chaotic here, and divergence failing repeatedly in a trend is not the market being rigged against you. It has structure — it is just structure that shows up somewhere other than the indicator pane. Real reversals tend to be preceded by a change in how price behaves at a level: a breakdown that fails to continue, absorption where selling stops moving price lower despite continued volume, a sweep of the prior low followed by a sharp move back through structure.
That behaviour is order flow and liquidity doing something before price fully commits to a new direction. An oscillator cannot see any of it, because an oscillator only ever sees price after the fact. Divergence, at its most useful, is the lagging echo of that institutional behaviour on your chart — not the cause of the reversal, and not a reliable early warning of one on its own.

Photo by AlphaTradeZone on Pexels
Regular divergence versus hidden divergence
Regular divergence — the version most people mean by default — is read as a possible trend reversal. Hidden divergence is close to its mirror image: price makes a higher low, the oscillator makes a lower low, and it is read as continuation evidence for an existing uptrend rather than a reversal warning. Mixing the two up is a common, quiet way of taking a trade in exactly the wrong direction with total conviction.
I traded pure divergence setups for the better part of a year, early on. Backtested beautifully. Live, it hated me specifically, in a way that felt personal for roughly eleven months before I accepted it was structural. The pattern was never wrong about momentum. I was wrong about what momentum was telling me.
Who bullish divergence suits, and who should wait
I can find this on YouTube for free — largely true, and most of what is out there teaches you to spot the shape correctly, which is a real and useful skill. Very little of it explains why the same shape behaves completely differently in a ranging market versus a strong trend, or why the confirmation step that reduces false entries also guarantees a worse entry price. That gap is not a conspiracy. It is just a harder thing to explain in a ten-minute video than a coloured arrow on a chart.
Bullish divergence suits traders using it as one piece of confluence alongside genuine structural context — a level that matters, a liquidity sweep, a change in how price is behaving — with position sizing that accounts for the fact confirmation costs you part of the move. It does not suit anyone trading it in isolation on a five-minute chart during a strong trend, expecting every higher low on RSI to be the one that finally sticks. Some of them will be. Most, in a strong trend, will not, and no amount of patience changes that ratio.
If you have been trading divergence signals alone and wondering why the "obvious" reversal keeps not arriving, you were not missing a subtlety. You were using a lagging description of the past as if it were a forecast of the future — an easy thing to do, because almost nobody draws the distinction clearly before you have already paid to learn it the hard way.
One more thing worth saying plainly: divergence around high-impact news is close to worthless. A central bank decision or an unexpected data print can erase a perfectly formed higher low on RSI in seconds, because the move is being driven by a fresh institutional repricing, not by the fading momentum the indicator was describing. If a red-flag event sits on the calendar in the next hour, that is not the moment to trust an oscillator over the news.
Frequently asked questions
What is bullish divergence?
Bullish divergence is when price makes a lower low while a momentum indicator, usually RSI or MACD, makes a higher low at the same time. It is read as a sign that selling pressure is weakening even though price is still falling, and is often treated as an early warning of a possible reversal.
What is the difference between regular and hidden divergence?
Regular divergence, the classic bullish or bearish setup, is read as a warning that an existing trend may reverse. Hidden divergence is close to the opposite: price and the indicator diverge in a way that suggests the existing trend is likely to continue rather than reverse. Confusing the two produces trades taken in the wrong direction entirely.
Is bullish divergence reliable?
On its own, not especially. Divergence can appear repeatedly through a strong trend without price ever reversing, because momentum can stay weak for a long time before a trend actually turns. It is more useful as one piece of context alongside market structure and liquidity than as a standalone entry signal.
What is RSI divergence?
RSI divergence is bullish or bearish divergence identified specifically using the Relative Strength Index, typically calculated over a 14-period lookback window. Because RSI is derived entirely from recent closing prices, RSI divergence can only be confirmed once two full swing points have already printed on the chart.
Can bullish divergence fail in a strong downtrend?
Yes, and it fails this way often. In a strong downtrend, momentum can weaken on several successive legs down, producing repeated bullish divergence signals, while price continues making new lows regardless. The divergence describes fading momentum on that leg. It does not guarantee the broader trend has actually ended.
Which indicator is best for spotting divergence, RSI or MACD?
Neither is structurally better, because both are calculated from the same closing-price history and share the same core limitation: the signal cannot exist until two completed swings are visible. RSI tends to react slightly faster on shorter lookback settings, while MACD often reads more smoothly on higher timeframes. Neither removes the underlying lag.
How do you confirm a bullish divergence before entering?
Most confirmation methods wait for a break of the swing high that formed between the two lows, or a bullish candle close back above a short-term structure level. That confirmation reduces false entries but also means, by definition, that the entry sits above the actual low the divergence was pointing at, which is the trade-off worth understanding before using it.
Marco Stavros has traded forex from London since 2009. He spent the better part of a year trading pure divergence setups and learned, slowly and at a cost, exactly where the pattern stops being useful. His apprentice still finds fourteen divergences before lunch most days. Marco checks structure before he checks RSI now. Learn more about Marco.
Start Seeing What's Really Moving Price
Most traders react to price. Learn to read what drives it.
See how Rethink Forex works