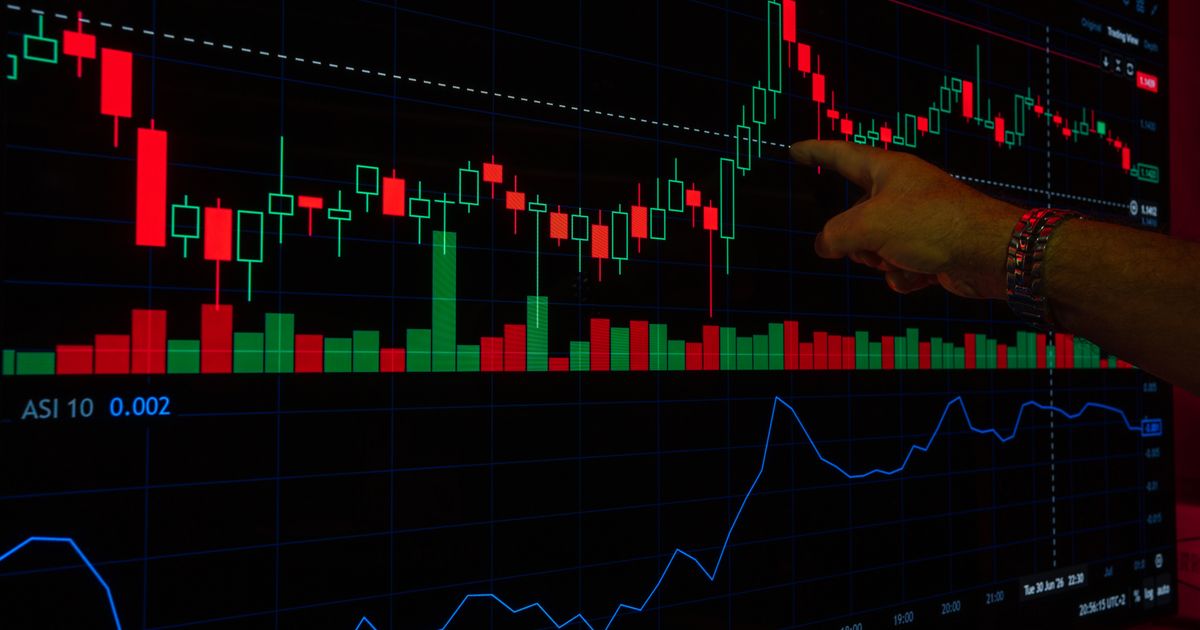
Photo by Rafael Minguet Delgado on Pexels
Technical Analysis: The Distraction Dressed Up as an Edge
Quick Answer
Technical analysis of the financial markets is the study of price and volume history — using tools like moving averages, the RSI, and chart patterns — to judge what a market is likely to do next. It genuinely describes real structure in the market. It is far less reliable as a standalone trigger, because millions of traders are taught to react at the exact same levels, which is precisely what makes those levels predictable to whoever is positioned ahead of the crowd.
Technical analysis sounds like something you would need a lab coat for. It is really just several hundred years of humans staring at squiggly lines and mostly agreeing where to draw them. (My wife says I do exactly the same thing with the football results. She is not wrong.)
Ask ten traders what technical analysis of the financial markets actually is and you will get ten flavours of the same answer: reading price and volume history to work out what a market is likely to do next. That part is not controversial. What almost nobody tells you is why the signal can be textbook-perfect and still lose, and that gap is worth taking seriously, because it is where most retail accounts quietly bleed out.
The signal that was right and still lost
Here is the exact sequence, because a vague version of this story does not do it justice: RSI reading overbought above 70, price tagging the 200-period moving average, a clean bearish candle to confirm it. Every box on the checklist ticked. You pulled the trigger on the short. Price broke straight through the average and kept running the other way. “My analysis was right but I still lost” is not self-pity in that moment. It is usually an accurate description of what happened.
The instinct is to conclude the setup was flawed, or that you executed badly, or that you are simply bad at this. None of that holds up under examination. The setup was fine. What was missing is something almost nobody teaching retail technical analysis bothers to explain: what the signal is actually made of, and who else is looking at it at exactly the same moment you are.
What technical analysis actually measures
Technical analysis of the financial markets is the study of price and volume history to judge what a market is likely to do next, using tools like moving averages, the relative strength index, and recognisable chart patterns rather than a company's balance sheet or an economy's growth figures. The thresholds are standardised almost everywhere you look — Fidelity's own investor education puts the RSI overbought line at 70 and oversold at 30, and treats a 50-day average crossing below a 200-day average, the so-called death cross, as one of the most widely watched signals in any market.
None of that makes technical analysis fake, and that is worth being direct about, because plenty of louder voices online will tell you it is nonsense dressed up as maths so they can sell you their own system instead. It is not nonsense. The market genuinely does have structure, and price genuinely does behave in ways that repeat. The part that gets left out is why it repeats, and that answer is less mystical and considerably more useful than most explanations bother to be.
Why the same levels keep attracting the same crowd
John Murphy's book carries almost the exact title of this post, and it has sold in the millions since 1986. So has every course, YouTube channel, and broker education hub that followed it, all teaching the same RSI thresholds, the same moving average crossovers, the same handful of candlestick patterns. That is not a criticism of any of them. It is the actual mechanism. When millions of traders are taught to place a stop, take profit, or entry at the identical mathematical level, that level stops being just a technical signal and becomes something far more concrete: a predictable concentration of orders sitting in one place.
This is the market having genuine structure, not the opposite. A level that a huge share of retail traders were taught to react to identically is, by definition, a level with real, measurable weight behind it. The chart is not lying to you. What is missing is the second half of the picture: everyone else reading the exact same textbook signal at the exact same threshold, at the exact same time you are.

Photo by AlphaTradeZone on Pexels
Why retail reacts late on the exact signal it was taught
Here is the part that actually explains the losing short from the start of this piece. A large, predictable pool of retail orders sitting at a well-known technical level is exactly the kind of liquidity a bigger position needs to fill against. It does not require a conspiracy meeting in a boardroom. It requires nothing more than knowing where several hundred thousand retail accounts were all taught to place the same trade, and being large enough to take the other side of it.
This is why confluence, stacking three or four textbook signals that all point the same way, can feel like overwhelming evidence and still fail at a higher rate than it should. (When three separate indicators agree, traders call it confluence. When three separate family members agree it is time to retire the Dire Straits CD, I call it a coincidence I am still fighting.) More agreeing indicators usually means more traders positioned identically at the identical level, not a stronger edge. Pull the trigger there, get run over, re-enter on the next equally clean setup, get run over again — rinse, repeat — and it starts to feel like the market has a personal issue with your account specifically. It does not. It is sequencing, and the sequence is built entirely out of retail traders using the tool exactly as they were taught to.
What technical analysis can actually do for you
This is where the entries-versus-context distinction matters more than almost anywhere else in trading. Technical analysis is extremely good at describing where the crowd's attention is sitting right now. It is considerably worse at telling you, on its own, the single moment to click buy or sell. Used as a description of context, an RSI reading or a moving average is genuinely useful information — it just is not the trigger most courses sell it as.

Photo by George Morina on Pexels
The traders who get more consistent results are not the ones who found a secret indicator. They are the ones who stopped treating a moving average crossover as a standalone signal and started reading it alongside market structure and order flow — where the level sits in the bigger picture, and whether real size is behind the move or it is just retail noise piling into a textbook setup. It is the same lesson covered from a different angle in why confident analysis still leads to losing trades, and it holds just as true for a single RSI reading as it does for a full checklist of confluence.
Who should leave technical analysis alone
Sure, heard that before — some corner of trading content always wants to tell you the tool everyone uses is secretly worthless, right before it sells you the tool nobody else has. I am not doing that here. I still use moving averages and RSI readings every week. The claim in this post is narrower, and I think more useful: the tool is real, and the way most retail education tells you to use it — as a standalone trigger — is what is costing you, not the maths itself.
You can, and almost certainly already have, watched a free video explaining how to draw an RSI or spot a death cross. There is genuinely nothing wrong with those tutorials — they teach the mechanics correctly. What they never get into is why the exact same setup fails as often as it works, because explaining that means admitting the tool is shared by millions of people reacting identically, and that is a far less marketable video than “three indicators that will change your trading.”
And here is who should genuinely leave all of this alone for now: if you do not yet have consistent position sizing, or you are adding indicators to a chart because the last loss shook your confidence rather than because you have a defined reason for each one, more technical analysis will not fix that. It will just give you more lines to blame. The U.S. Securities and Exchange Commission is blunt about this in its own investor guidance — most people attempting fast, frequent trading do not have the capital or the temperament for the losses it produces, textbook setup or not, and the FCA's own figures on retail CFD accounts bear that out. None of this means you were undisciplined or broken for not knowing where the gap was. Retail technical analysis education was built to sell courses and count clicks, not to explain why a shared signal stops being an edge the moment everyone is using it.
My apprentice, a few months into this, put nine indicators on one chart because he had read that more confirmation meant more safety. It looked like a Christmas tree that had lost a fight. I made him delete six of them and explain, out loud, what each of the remaining three was actually measuring. He groaned. He also stopped losing quite so often. Next time every box on your checklist ticks and the trade still runs the wrong way, you will at least know it was not the lab coat that failed you.
Frequently asked questions
What is technical analysis in simple terms?
Technical analysis is the study of price and volume history to judge what a market is likely to do next, using tools like moving averages, the relative strength index, and chart patterns rather than a company or economy's underlying fundamentals.
Does technical analysis actually work?
It genuinely describes structure that exists in the market, largely because so many participants use the same tools and react at the same levels. It is far less reliable as a standalone predictor of the next move, which is a different claim to whether it works at all.
Why do textbook technical analysis setups fail so often for retail traders?
Because the setup is taught identically to millions of traders, the level it points to becomes a large, predictable concentration of orders. That makes it an efficient place for larger positions to fill against, which often looks, from the retail side, like the signal simply failing.
What is the difference between technical analysis and fundamental analysis?
Technical analysis studies price and volume history on a chart. Fundamental analysis studies the underlying economic, financial, or company data behind the asset, such as interest rates or earnings. Most experienced traders use elements of both rather than treating them as rivals.
Is technical analysis a self-fulfilling prophecy?
Partly, and there is nothing embarrassing about that. When a huge share of market participants are taught to react at the same mathematical level, that level develops real, measurable weight simply because of how many orders sit there, regardless of whether the underlying theory is otherwise sound.
Should I stop using indicators altogether?
No. The tools are not the problem. Using an indicator as a standalone entry trigger instead of as one piece of context alongside market structure and order flow is usually where the results fall apart.
Marco Stavros has traded forex from London since 2009. He has had eleven indicators on one chart at the same time, none of which helped, and now runs three he can actually explain out loud without checking a manual. Learn more about Marco.
Start Seeing What's Really Moving Price
Most traders react to price. Learn to read what drives it.
See how Rethink Forex works