
Photo by Vanessa Garcia on Pexels
What Losing Trades Actually Tell Us About the Market
There is a specific habit almost every losing trader develops without ever deciding to. The moment your stop hits, you close the chart. You do not watch what happens next. Not because you are lazy or undisciplined — because watching price do exactly what you expected, thirty seconds after your position closed, is its own particular kind of pain. Worse, in a strange way, than the loss itself.
So you look away. You close the tab, open something else, tell yourself you will review it later. Later rarely comes, because reliving a fresh loss is the last thing anyone wants to do voluntarily. That instinct is completely human. It is also quietly expensive, because looking away means throwing out the one genuinely useful thing that loss had left to offer you.
You are not avoiding your losses because you are weak. You were never told there was anything in them worth staying for.
If trading losses have pushed you to a place that feels overwhelming beyond money, please reach out. The Samaritans are available 24 hours a day, 7 days a week, at 116 123 — free, confidential, and without judgment.
The short answer
A single losing trade mostly tells you how it felt. A hundred losing trades, examined together, tell you where the market keeps clearing liquidity before it moves — because a specific, repeatable pattern emerges once you look at where the stops sat and what price did afterward.
That pattern is not a theory borrowed from a course. It is sitting in your own trade history, mostly unread.
The habit of looking away
You know the shape of it. Stop hit. Chart closed. Maybe a scroll through something unrelated for ten minutes to let the feeling pass. When you finally do look back, hours or days later, price has moved on and the moment that actually mattered — what happened in the minutes right after your stop — is buried under everything that came since.
Stop hunted, again, and this time you did not even stay to see it confirmed. My analysis was right but I still lost, said to an empty room, because the tab was already closed by the time price proved the point. Rinse, repeat, except the repeating happens partly because the evidence that could have broken the cycle gets closed before it is ever read.
This is not about willpower. Watching a trade you just lost immediately vindicate your original read is genuinely unpleasant — a small, specific humiliation that most people would rather not sit through twice. The cost of avoiding it is just quieter than the cost of losing the trade in the first place, which is exactly why it goes unnoticed for so long.
Before getting to what you would actually find if you stayed, it is worth looking at what most trading advice tells you to do with a loss instead — because it usually points you somewhere other than the chart itself.
What the industry told you — and why it is incomplete
Standard advice after a loss tends to land in one place: review your own decision. Was the entry valid. Was the size correct. Did you follow your rules. All genuinely useful questions, and all pointed entirely inward.
What gets left out is the other half of the trade — the market's half. A loss is not just a record of what you did. It is also a record of exactly how price behaved at a specific level, at a specific time, on the specific instrument you actually trade. Reviewing only your own decision-making treats every loss as a closed personal-performance file. It throws away the market data sitting right next to it.
On tilt, most traders either bury the loss completely or replay it purely as self-criticism. Both responses skip the same step: actually looking at what price did after it took your stop, calmly, once the sting has faded enough to look properly.
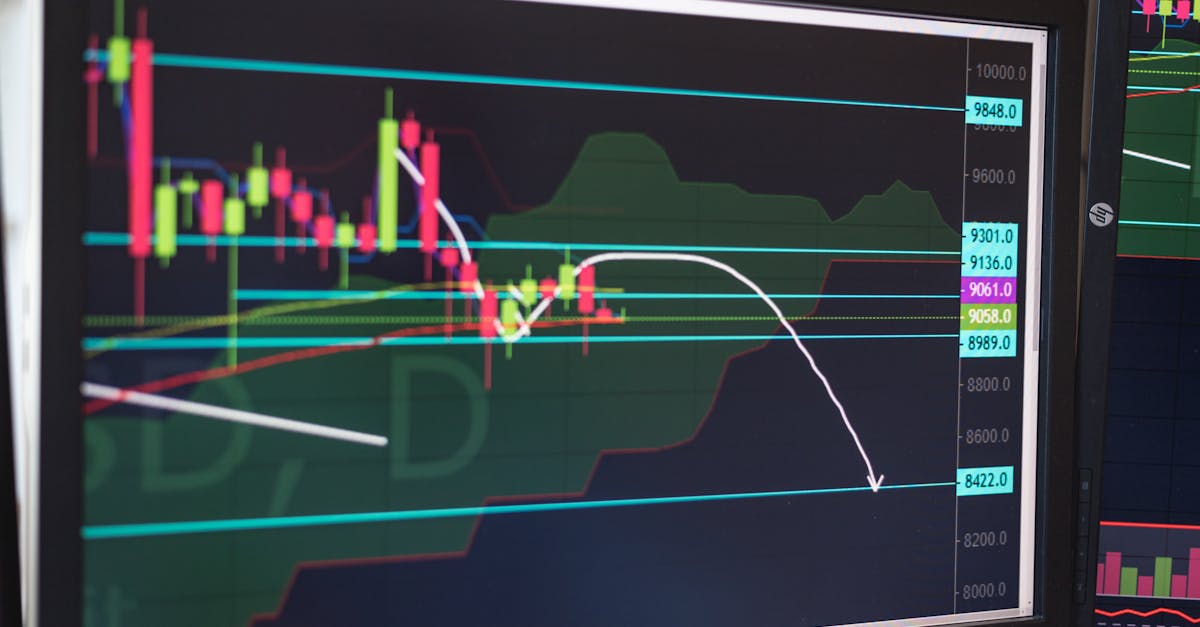
Photo by AlphaTradeZone on Pexels
What losses actually show when you stop looking away
Go back through a stretch of stopped-out trades and mark two things for each one: where the stop sat relative to the nearest obvious swing high, swing low, or round number, and what price did in the following fifteen to sixty minutes. Do this for one trade and you have an anecdote. Do it for fifteen or twenty, and a shape starts to repeat that is hard to unsee once you notice it — price pushes just beyond the obvious level, pauses, then reverses.
This is not a coincidence specific to you. Research on currency markets, including a staff study from the Federal Reserve Bank of New York on stop-loss orders and price cascades, has found that exchange rates reverse course relatively often once they clear clusters of stop-loss orders, and that the reaction to those clusters tends to be larger and longer-lasting than the reaction around ordinary take-profit levels. Retail stops cluster in predictable places for a simple reason: most retail education teaches traders to place them at the same obvious spots. The market does not need to target you individually. It only needs the liquidity that clustering creates, in the same way order flow consistently seeks out the easiest pools of resting orders before a genuine move begins.
I did not watch a single stopped-out chart for close to two years. Closed it, moved on, told myself there was nothing left to learn from a trade that had already failed. When I finally forced myself to sit through a losing trade's aftermath instead of closing the tab, the pattern took about a dozen trades to become obvious, and about two years longer than it should have to notice.
Seen this way, the market is not chaotic, and it is not personally rigged against you either. It has a genuine, repeatable structure — one that shows up in your own history as clearly as in any textbook example, once you are willing to sit with it for the few uncomfortable minutes right after a stop.
What this means — and what it does not
This does not undo a single loss, and it will not make the next trade certain. The money is still gone either way. What changes is what the loss is worth to you afterward — the difference between a cost with nothing attached to it, and a cost that came with a small, specific, personally verified piece of information about how price behaves around the levels you actually trade.
I have tried everything and still lose is usually true, and usually describes someone who tried five different strategies without ever mining the data sitting inside the one they already had. Switching systems without reviewing what your own stopped-out trades were quietly showing you just means starting the same structural blind spot over on a new chart. The levels worth marking are often the same ones covered in order block behaviour — it just takes reviewing your own losses to see them confirmed rather than taking the idea on trust.
(The uncomfortable part worth saying plainly: this review only works if you actually watch the aftermath instead of skimming a summary later. The information lives in the specific minutes after the stop, not in the tidy version you reconstruct from memory a week on.)

Photo by Arina Krasnikova on Pexels
Who this post is not for
Reviewing losses this closely is genuinely useful. It is also not something everyone should be doing right now, and it is worth saying plainly who should wait.
If you are trading money you cannot afford to lose, no amount of pattern recognition changes what a losing streak does to your life. Fix the stake and the risk management before you fix the review process.
If watching a stopped-out chart sends you straight into revenge trading rather than calm review, you are not ready for this exercise yet, and that is fine. Give it a day of distance first. The information will still be there tomorrow. Your account may not survive trading it tonight.
If someone close to you is worried about how much time or emotion this is taking up, take that seriously before taking this post's word for it. A chart cannot tell you how you are actually doing. People who know you can.
If none of that applies, the exercise is simple enough to start today: pick your last ten stopped-out trades, and for each one, look at what price did in the hour after. Not to relive the loss. To finally collect what it was trying to tell you the whole time.
Frequently asked questions
What can losing trades actually teach you?
Studied individually, not much beyond how a single trade felt. Studied as a group — where each stop sat relative to an obvious structural level, and what price did in the following hour — losing trades reveal a consistent pattern: price frequently pushes through the obvious level, pauses, and reverses. That consistency is evidence of market structure, visible in your own history, not a theory from a course.
Why do so many stop losses get hit right before a reversal?
Retail stop losses cluster in predictable locations — just beyond obvious highs, lows, and round numbers. Academic research on currency markets has found that price often reverses shortly after clearing these clusters, because the liquidity created by triggering them gives larger orders room to fill. It is a structural feature of how the market absorbs size, not a personal pattern of bad luck.
Should I watch the chart after my stop loss gets hit?
Yes, even though it is uncomfortable. What price does in the period after your stop is some of the most useful, specific data available to you, because it is drawn from the exact instrument and conditions you actually trade. Closing the chart immediately protects your mood in the moment and removes the only genuinely useful part of the experience.
How do I start reviewing my losing trades properly?
For each stopped-out trade, mark where the stop sat relative to the nearest obvious swing high, swing low, or round number. Then note what price did in the following 15 to 60 minutes. After 15 to 20 trades, patterns in where price actually goes after clearing those levels usually become visible, even without special tools.
Does this mean the market is rigged against retail traders?
No. It means the market has structure, and that structure includes needing liquidity to move larger size, which tends to be found at the same predictable levels retail traders are taught to place stops. Nobody is targeting you personally. The mechanism is impersonal, consistent, and — once you see it in your own trade history — genuinely useful.
Can reviewing old losses actually improve future trades?
It will not undo the losses already taken, and it will not make the next trade certain. What it does is show you, specifically, how price around your instruments tends to behave near obvious levels, which changes where you place stops, how you read a setup, and what you expect immediately after a level breaks.
Marco has traded forex from London since 2009. He spent close to two years closing the chart the second a stop hit, and considers that his most expensive habit, more expensive than most of the trades themselves. Rethink Forex exists to hand over what he eventually found once he stayed. More about Marco.
Start Seeing What's Really Moving Price
Most traders react to price. Learn to read what drives it.
See how Rethink Forex works